The impact of climate change was found to be higher at the Arctic compared to any other region on Earth. Though, the scarcity of weather stations at higher latitudes and the difficulty to maintain them have made it difficult to map the patterns of climate variability. This research project was conducted while working for the the Interdisciplinary Centre on Climate Change (IC3) at the University of Waterloo and as part of the European Space Agency Initiative (DUE Permafrost) aiming at monitoring land surface phenology above 50 degree north using remote sensing data.
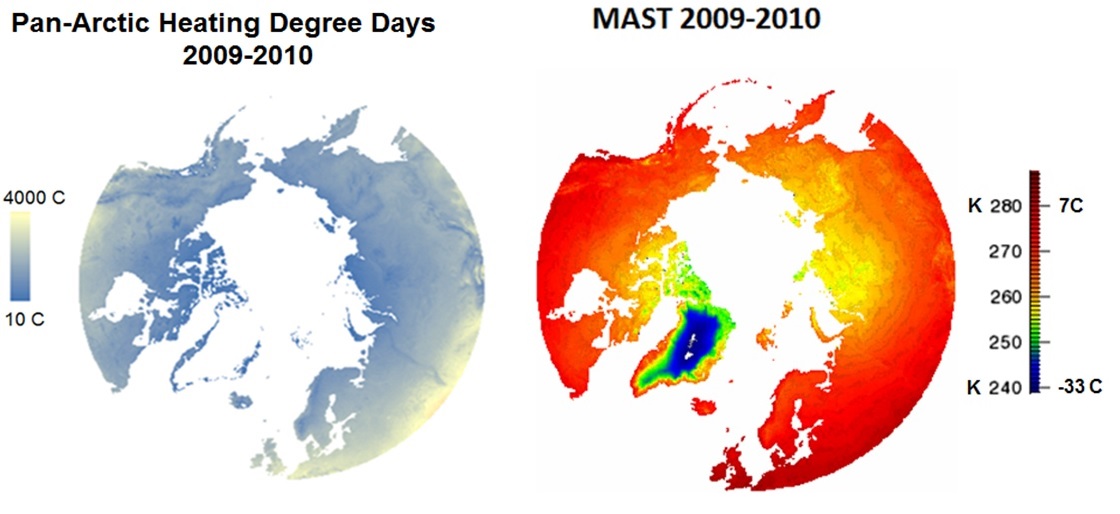
 The first goal of this project was to estimate phenological parameters, such as cumulative cooling and heating degree days, mean annual surface temperature and length of the growing season over the pan-Arctic using data from spaceborne sensors MODIS and A-ATSR. Estimating these parameters using hourly measurements from weather stations data is a straightforward process. However, extracting them from satellite observations, which are characterized by being irregular and limited to a few measurements per day is a challenge. In order to overcome these limitations, an IDL program was designed to aggregate original level2 observations MODIS (MOD11_L2/MYD11_L2) and A-ATSR (ATS_NR_2P) to extract ecological parameters of interest.
The recursive program considers a minimum number of level 2 observations to start the spatial and temporal aggregation, establish the maximum and minimum temperatures during the defined period and project the estimated parameters on to a Northern hemisphere ease grid with 25km pixel size.
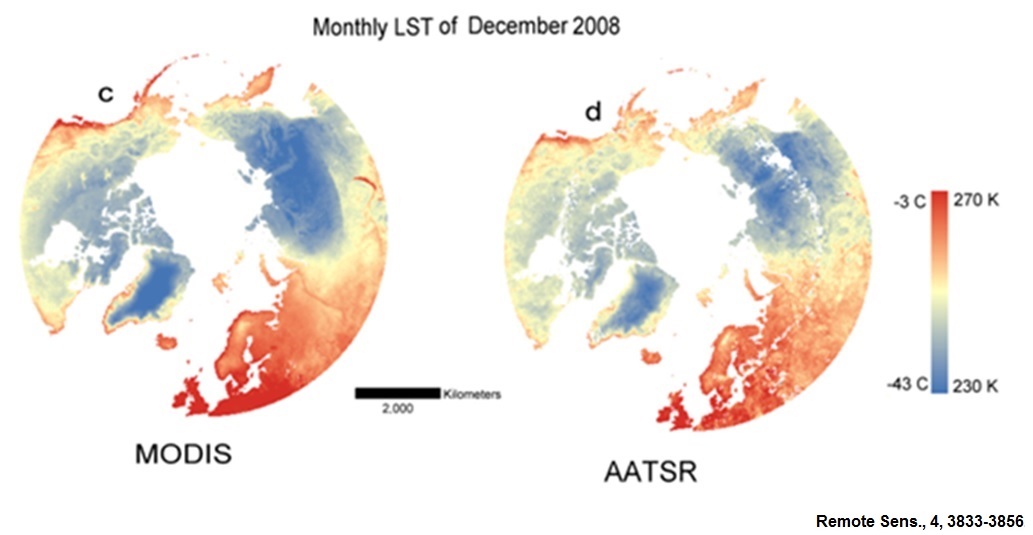
The advantage of using remote sensing data compared to weather station measurements is its ability to reveal spatial patterns associated with phenological parameters (below figures). However, there are a different sources of uncertainty in remotely-sensed parameters that need to be further analyzed. For example, super cold observations featuring the top of clouds could pass undetected specially under snow on ground conditions causing a significant cold bias and difficulty in estimating spring onset. In addition, spaceborne thermal sensor cannot image under cloudy conditions and missing data during cloudy periods could affect the calculation of cumulative heating and cooling degrees.
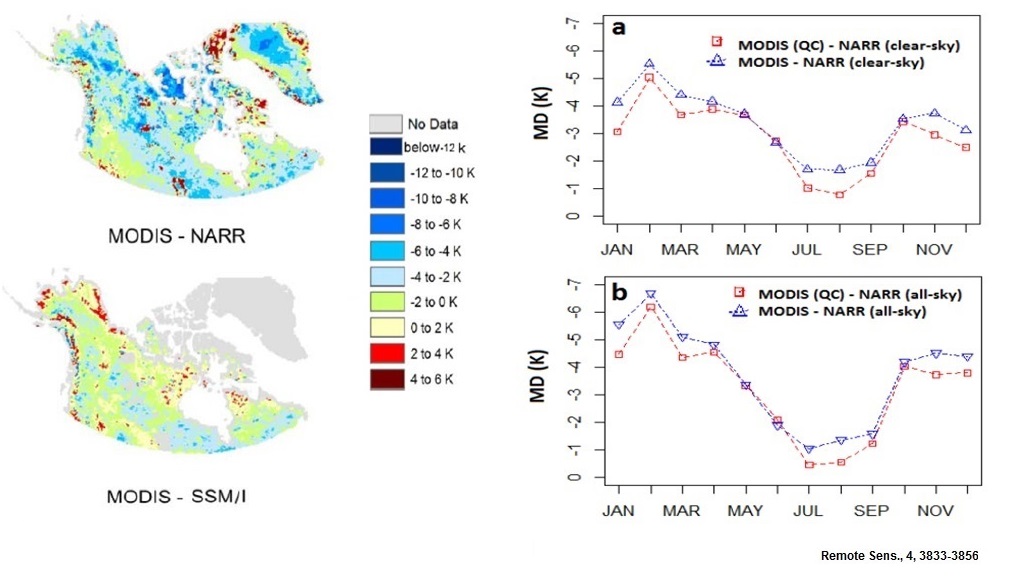
 In order to quantify the sources of uncertainty, a series of comparisons were conducted with North American Reanalysis (NARR) and skin temperature from passive microwave (SSM/I). Comparison results suggested that missing data are a minor source of bias (approximately 1K offset). Nevertheless, estimated heating degree days during the summer months are more accurate (3K) compared to cooling degree days during winter suffered (5-6K). Cloud detection errors and the suitability of LST retrieval algorithm to dry arctic winter weather were suggest as sources of that deviation.
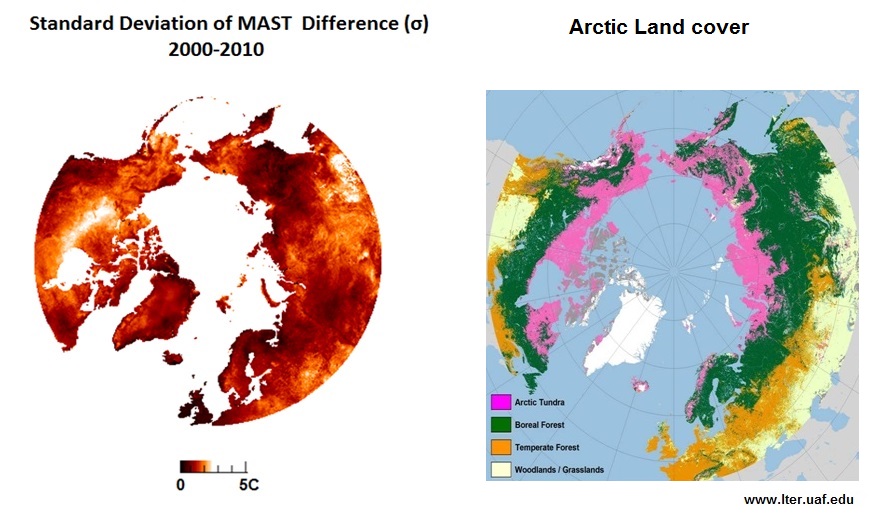
Changes in cumulative degree days, length of the growing season and spring timing have strong impacts on northern environments. A map of the standard deviation of MAST was calculated to spot regions experiencing high variability in cumulative degree days during the past decade (2000-2010). The standard deviation was calculated using the year to year difference in order to reduce the autocorrelation bias and minimize the seasonal systematic bias in the estimates of variance. results suggest that transition from boral forest to tundra in northern Canada and the boreal forest in southern Siberia are among the regions that experienced the highest level of interannual variation.